Understand your Dashboard
How To Use The Dashboard
Your Dashboard is an overview of your business. This is the first thing that you will see when you log into . It will outline the progress and performance of your business. Here are the potential different parts of your default Dashboard:
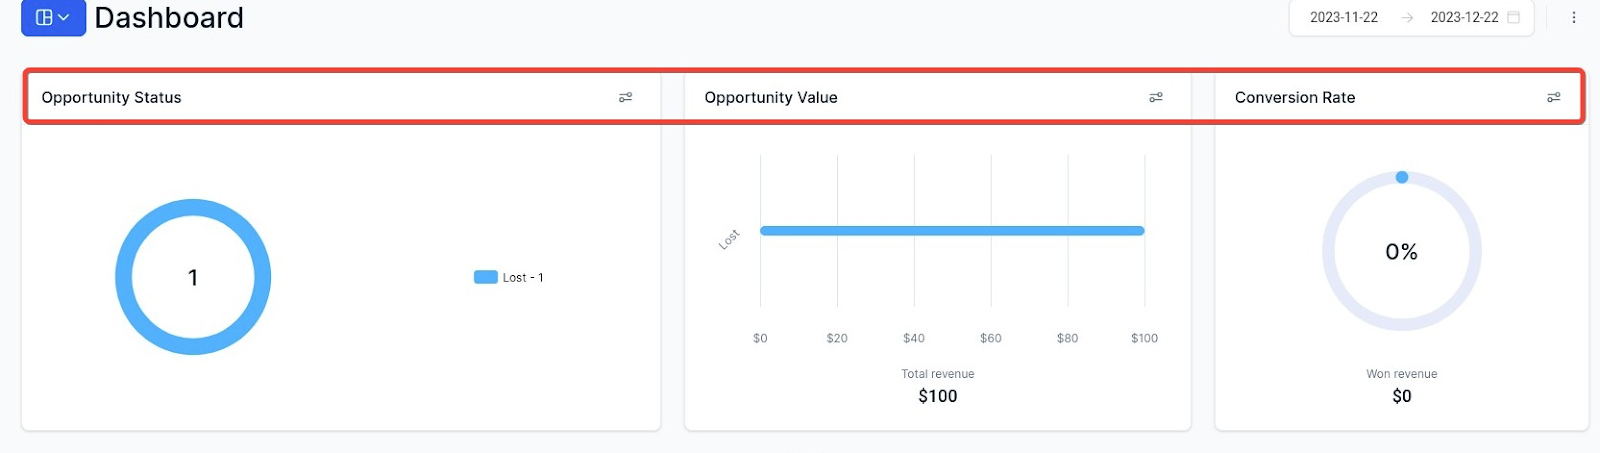
Row 1:
- Opportunity Status: Status of Leads in your Pipeline
- Opportunity Value: All your leads' total worth
- Conversion Rate: Percentage of your ‘WON’ leads/accounts
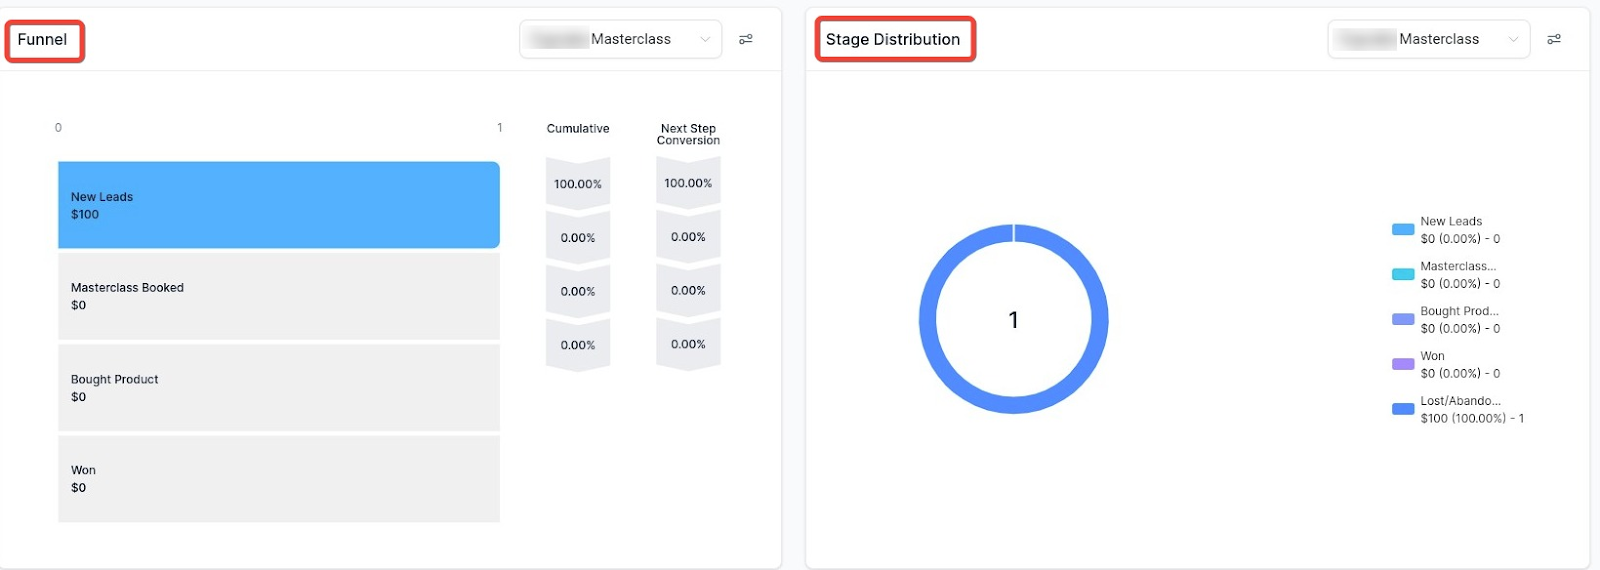
Row 2:
- Funnel: A visual representation of what stages your opportunities are within your Pipeline
- Stages Distribution: This is a cycle graph of your Pipeline
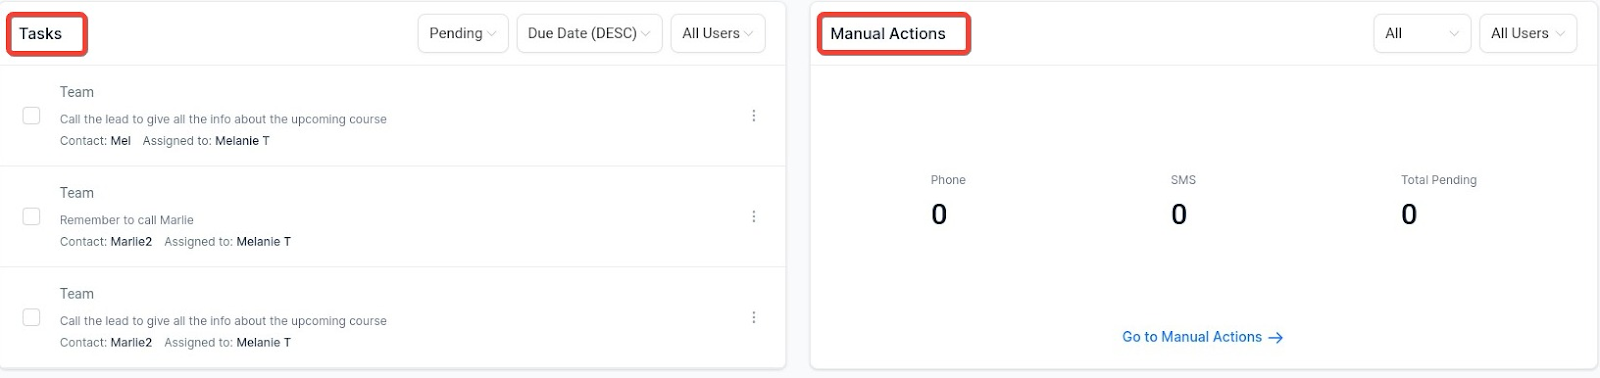
Row 3:
- Manual Actions: An overview of manual actions
- Tasks: A list of assigned tasks for one or all users within your account.
Row 4:
- Lead Source Report: Here you can see where your leads came from and what their values are.
